Module 8: Other Visualizations
Ribbon Charts
The ribbon charts allow you to see what may change between 3rd and 5th place by cleverly moving the "ribbon" around.
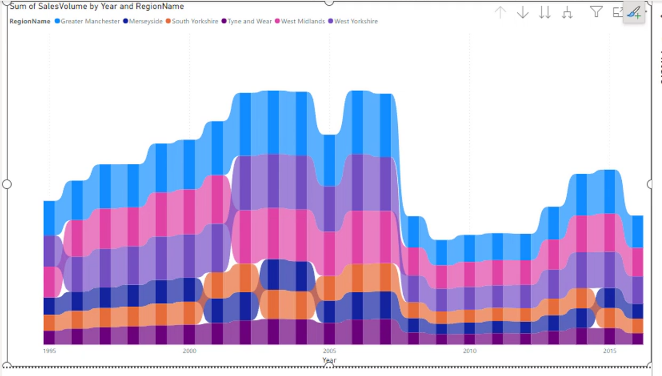
It's similar to the stacked column chart, but it allows you to see the changes in rank between the different categories.
The ribbon chart is a great way to visualize the changes in rank between different categories over time. It provides a clear view of how each category performs relative to others, making it easier to identify trends and shifts in performance.
It is missing a Y axis because the focus is on the rank and the relative position of the categories rather than their absolute values. The absence of a Y axis emphasizes the changes in rank and allows for a cleaner, more focused visualization of the data.
Waterfall Charts
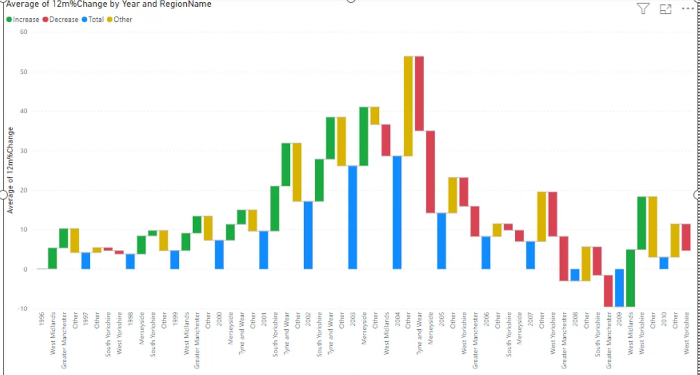
The waterfall chart is a great way to show how a starting value moves step by step through a series of positive and negative changes. It is especially useful when you want to explain how a total was built or how it changed over time.
A waterfall chart is often used for things like revenue, profit, expenses, or forecast variance. Each bar represents a change, and the chart visually shows whether each step increased or decreased the total. The bars are stacked in a way that makes it easy to see the cumulative effect of each factor.
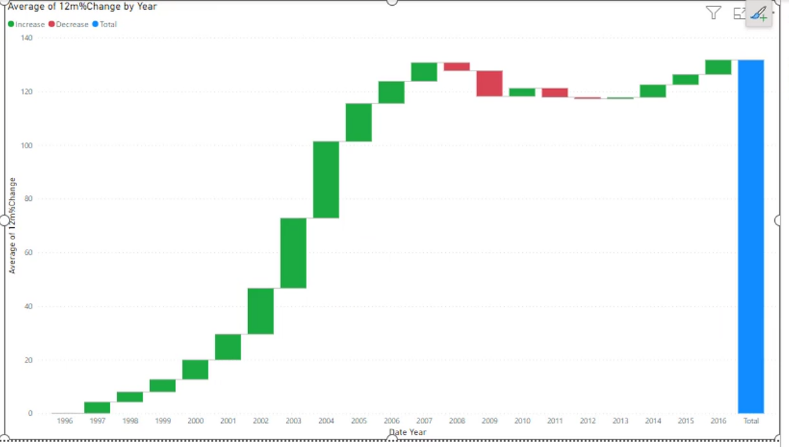
This type of chart is particularly helpful when you want to answer questions like: "What caused the final result to be higher or lower than expected?" It makes it easy to see which categories had the biggest impact and whether those impacts were positive or negative.
The waterfall chart is also helpful for comparing a starting point to an ending point while showing the intermediate steps in between. It is a very effective chart for business analysis because it goes beyond raw totals and explains the drivers behind the change.
Scatter, Bubble and Dot Charts
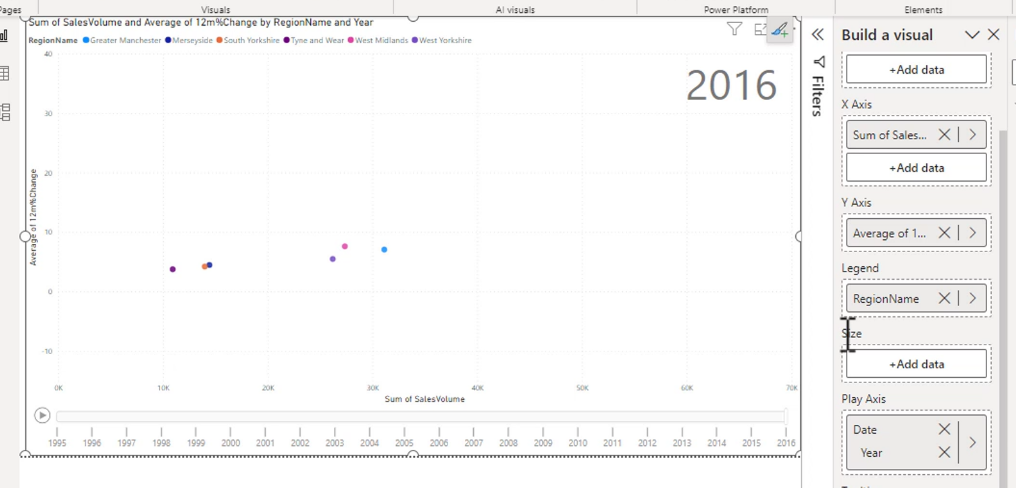
A scatter graph gives you a way to visualize the relationship between two variables. It is particularly useful for identifying correlations, trends, and outliers in your data. Each point on the scatter plot represents an observation, with its position determined by the values of the two variables being compared.
There are new axis options - the play axis. The play axis allows you to animate the scatter plot over time, showing how the relationship between the variables changes. This can be particularly useful for visualizing trends and patterns that may not be immediately apparent in a static chart.
A bubble chart is a variation of the scatter plot that adds a third dimension to the data by using the size of the bubbles to represent an additional variable. This allows you to visualize three variables simultaneously, making it easier to identify patterns and relationships in your data.
Your icons can be changed to different shapes, and the size of the bubbles can be adjusted to represent different values. This makes bubble charts a powerful tool for visualizing complex data sets.
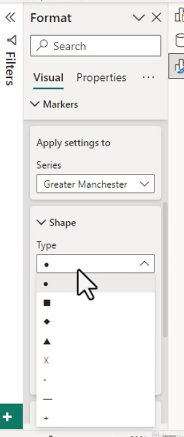
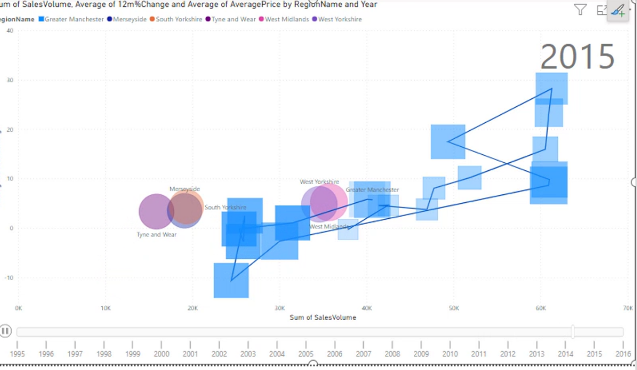
Another option is this trail looking thing when you click on an item. It is a way to show the path of the data points over time, which can be useful for understanding how the relationship between the variables evolves. This can be particularly helpful for identifying trends and patterns that may not be immediately apparent in a static chart.
Pie Charts and Donut Charts
Pie charts and donut charts are used to show the proportion of different categories within a whole. They are particularly useful for visualizing the relative sizes of parts to a whole, making it easy to see which categories are the largest or smallest. Pie charts are circular charts divided into slices, with each slice representing a category's contribution to the total. Donut charts are similar but have a hole in the center, which can be used to display additional information or to make the chart more visually appealing.
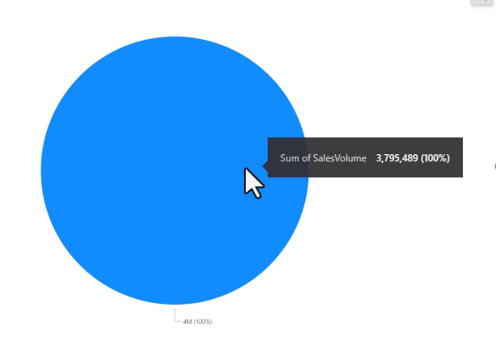
This pie is 100% blueberry.
That's better.
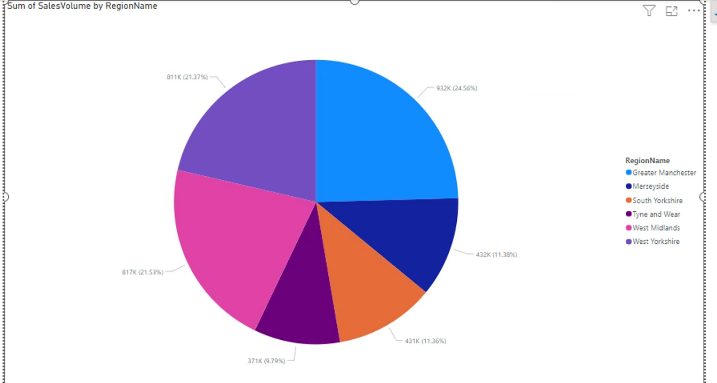
Even more detailed.
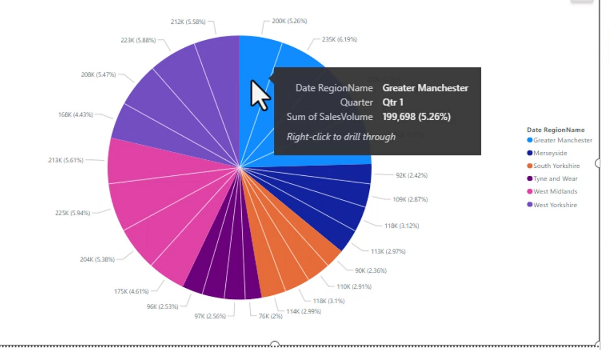 There are a lot of dumb options like this:
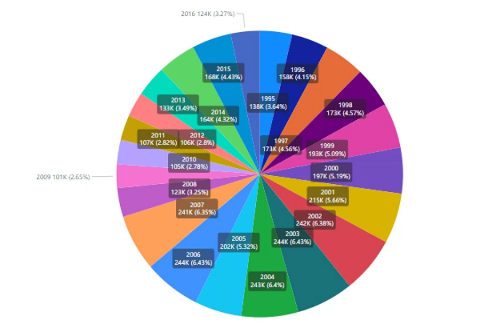
Treemap Charts
Treemap charts are a way to visualize hierarchical data using nested rectangles. Each rectangle represents a category, and the size of the rectangle corresponds to the value of that category. Treemaps are particularly useful for showing proportions and relationships within a hierarchy, making it easy to identify patterns and trends in the data. They are often used to visualize large datasets with multiple levels of categories, allowing for a clear and concise representation of complex information.
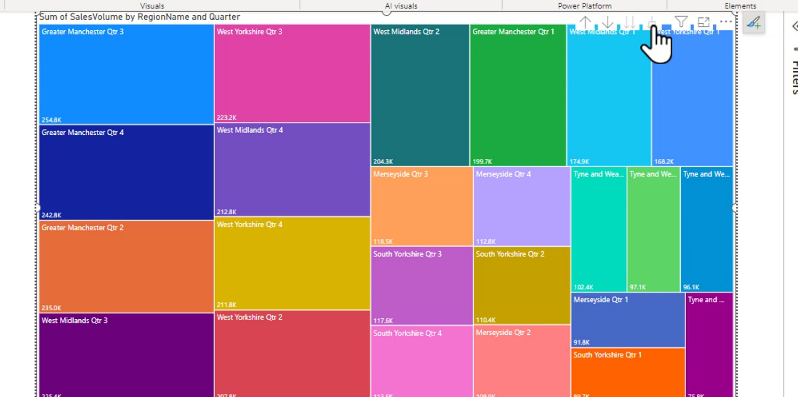
This type of chart will be very helpful when when you want to drill down into the data to see how different categories contribute to the overall picture. It allows you to quickly identify which categories are performing well and which may need attention.
Funnel Charts
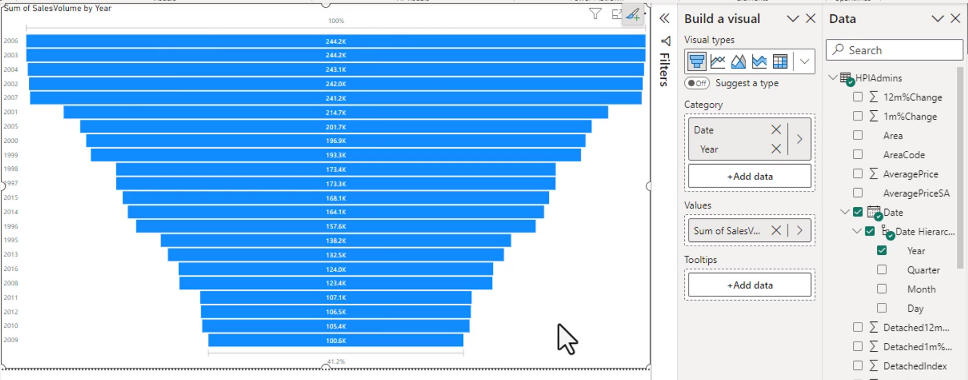
Funnel charts are used to visualize the flow of data through a process, typically representing stages in a sales or conversion funnel. Each stage of the funnel is represented by a section of the chart, with the width of each section corresponding to the number of items or value at that stage. Funnel charts are particularly useful for identifying bottlenecks and areas for improvement in a process, making it easy to see where potential customers may be dropping off or where additional resources may be needed to improve conversion rates.
Anything that is linear will make a decent funnel chart.
Import a Custom Visual - not on exam
You can download custom visuals from the Microsoft AppSource marketplace. These visuals are created by third-party developers and can provide additional functionality and visualization options beyond what is available in Power BI by default. To import a custom visual, you can go to the "Visualizations" pane in Power BI, click on the "Import a custom visual" button, and then select the visual file you want to import. Once imported, the custom visual will be available for use in your reports and dashboards.
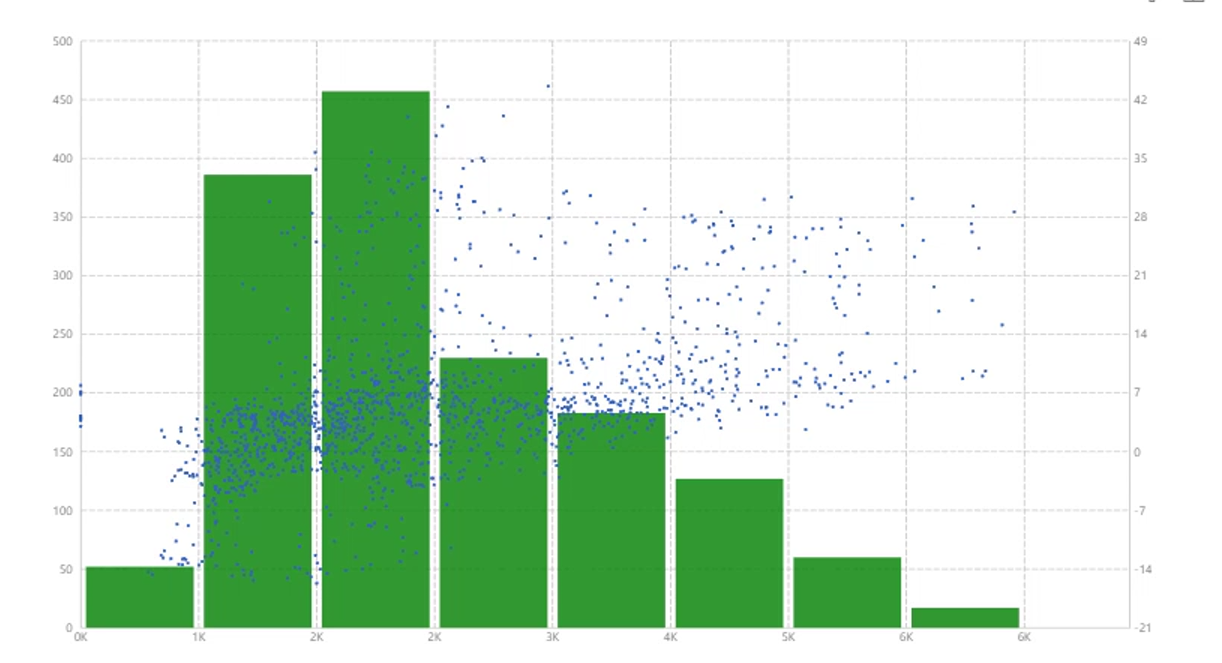
Get you some interesting visuals like this scatter bar chart.
Practice Activity 5
-
Rename the "Breakdown by month" page as "Breakdown".
-
Change the area graph to a pie chart, and resize it so that it fits in the top-left hand corner.
-
Create a scatter chart (which is really a bubble chart) which shows Day of "Date created" in the X Axis, Size in the Y-Axis, and Count of "#" in the Size. This graph should be in the top-right hand corner.
-
Create a waterfall chart with Path in the Category and Size in the Values (in older versions, this was called the "Y axis"). This should go along the bottom of the page (but still leave room for the "Back" button).
-
Go back to the Dashboard, and select "All years" from the Bookmarks.
-
Drill through to the "Breakdown" page using the year 2007, and then the year 2014. Have a look at the waterfall chart both times - would it work better as a Treemap or a Donut chart?
-
In the "Dashboard" page, see what the "Size by Month" chart would look like as a Ribbon, with "File extension" in the Legend, compared as a Stacked column chart. Which looks better?